Google Update Checker
Google Algorithm Update Checker
Fast, easy, and precise check if your site was affected by a Google Algorithm update (Panda, Penguin, etc.). Traffic analysis against a calendar of Google Updates to see if a particular change had an effect.
Try it nowUse all our tools for 30 days! No credit card required.

Evaluate the impact of Google Updates
Quickly estimate the likelihood that you were hit by a particular algorithm change.
- In-depth Google Analytics traffic analysis for precise results
- 100 times faster than a trained SEO analyst
- Always up-to-date Google updates calendar (with details)
- Landing Page filters for better insights into page-level impacts
- Catches Panda, Penguin, Hummingbird, and many other updates
Features of the Google Update Checker

Update impact analysis
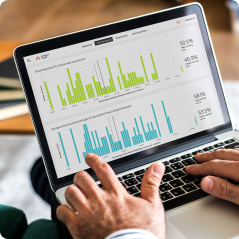
The main output of the checker is a graph with google organic traffic with the dates of the updates superimposed. Updates where the likelihood of an effect is high are highlighted. The determination of the likelihood of an impact relies on deep analysis, including seasonality adjustments and ruling out other reasons for any traffic change.
An update which is not highlighted likely has no effect, even though there might be a traffic drop. If it is unclear why an effect has not been highlighted, investigate the traffic year over year and check for Google Analytics tracking issues.
Page-level drill-down
Some updates have a page-level effect which might not be visible on the overall level. Including only particular pages in the analysis, or excluding some pages might produce more accurate results in such cases. Obviously, this would apply mostly to larger websites and especially if different sections of it have significantly different qualities.


In-depth investigation
Once an impact is determined, the tool shows a graph demonstrating the before and after difference that makes it easier to spot if there was an organic traffic drop or increase.
The detailed update description which is available for all updates also helps in determining the reason for the impact and therefore to determine the best course of action, if any.
Try the google algorithm checker
Experience the power and utility of all our Google Analytics automation tools during the 30-day free trial. No credit card required.
Start free trialSee what our clients have to say
 Thomas Bosilevac
President and Founder, MashMetrics
 Chris Hickey
Director of Inbound Services, InFlow